H3 Spatial Indexing: Unleashing the Power of Geospatial Analysis in Disaster Management
17 July 2023
Author : Atik Nurul Aini, Dewa Putu AM
Editor : Mizan Bustanul Fuady Bisri


As our commitment to researching and developing the latest innovations in disaster risk reduction, the CARI! Team has been actively exploring the concept of H3 spatial indexing, and how it could be applied in the context of disaster risk management, since November 2022. H3 spatial indexing is a recent concept and tool that enable a more effective and efficient organization and management as well as geospatial analysis. The H3 main added value is it reduces the loss of spatial variation of each data set processed through geospatial analysis. In March 2023, we presented our research findings at the 2nd International Seminar on Earth Sciences and Technology (ISEST) 2023, focusing on applying H3 in assessing earthquake risks in Sorong City. We also showcased an H3 application in Greater Semarang here. Without a doubt, the utilization of the H3 Spatial Indexing method can unleash the power of geospatial analysis in disaster management.
This method was developed by Uber and released in an open-source library. By utilizing H3, we divide the Earth's surface into structured hexagonal cells equipped with a unique id for each cell –hence the H3 Index. This structured grid system H3 has 15 levels of resolution detail from level 0 (0.5 meters) to level 15 (1000 km). In the context of disaster management, H3 Spatial Indexing becomes an invaluable tool as it tidies up the spatial data indexing system and enables a lot easier cross-tabs between data points. Data that has been indexed in H3 enhance the plethora of possible geospatial analysis, enables more flexible and accurate risk mapping, and facilitates dynamic informed decision-making. For example, H3 enables us to analyze geographic information to set dynamic prices and make other decisions on a city-wide level.
The advantages and benefits of using H3 Spatial Indexing are extensive. One of its advantages is its ability to enhance our understanding of spatial patterns from various kinds of data with various levels of resolution both static data and time series data. By leveraging H3, we can identify susceptible areas to certain types of disasters and depict vulnerability patterns more clearly. This can be done by using spatial pattern analysis for each physical parameter related to the disaster, either by using general models or AI-based intelligent models. This will be made easier when the data is neatly indexed in H3. Furthermore, H3 allows for more accurate risk mapping by integrating various types of data, such as social, economic, and environmental data, into a more refined micro-level locus. This enables us to make more types of services to enhance the decision support system and provide more effective disaster risk reduction and crisis management. As demonstrated in our research paper, through the use of visual comparative analysis, it is revealed that on the map depicting risk assessment results based on the current methodology (based on administrative boundaries), the area with the highest risk is found in Sorong Manoi District, while other areas exhibit relatively low levels of risk. On the map depicting risk assessment results based on H3, the highest risk values are observed in Sorong Manoi, Sorong Kota, and Sorong Timur Districts. Through visual analysis, it is evident that both methods yield similar outcomes by indicating that the highest-risk area is located in Sorong Manoi. However, the H3-based method provides more specific information at the level of hexagonal cells, successfully identifying Sorong Kota and Sorong Timur as high-risk areas. H3 is capable of revealing patterns and finer levels of risk in specific locations within a district/city, offering a better and more nuanced understanding of risk.
We recognize that techniques and tools for implementing H3 Spatial Indexing are continuously evolving. Various algorithms and methods have been developed to optimize the use of H3. Numerous software and libraries are available to support the implementation of H3 Spatial Indexing in geospatial analysis. With the support of these technologies, it is increasingly easier for experts and practitioners to harness the full potential of H3 in disaster management. With reference to this framework, in the future, we will continue to explore the potential of using H3 as well as various other spatial analysis technologies. For that, we believe that to speed up our learning process we need to always collaborate with various parties. As one of the first steps in our introduction to this H3 technology, we have conducted a case study for Greater Semarang.
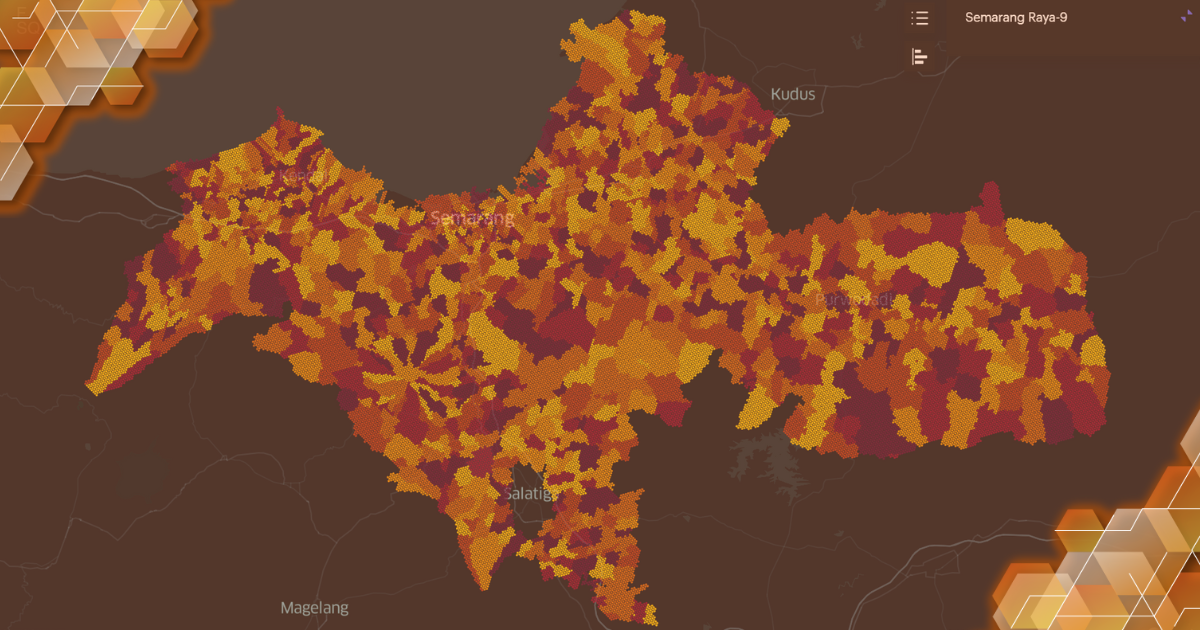
In the application of H3 Spatial Indexing to disaster management, impressive examples can be observed. One notable example is the implementation of H3 in analyzing flood risks in the Semarang Raya region. Our analysis can be accessed via the following link. In this study, we utilized H3 to integrate various spatial data watersheds in Greater Semarang, sea-level rise, flood occurrences, and flood hazard indices. Through the utilization of H3 Spatial Indexing, we analyzed these data by combining them into cell H3 so that each data is evenly distributed throughout the region, which also minimizes the loss of spatial variation of each data set. This is because the geometry of each data such as watershed data, sea level rise data, and different locations of flood events will be uniformed into a hexagonal grid geometry. A geospatial analysis using H3 allows for a better and more detailed understanding of flood patterns. We discovered that H3 Spatial Indexing allows us to identify the most vulnerable areas to floods, map hazardous water flow paths, and determine risk levels more clearly.
By leveraging H3 Spatial Indexing, we identify areas along specific rivers that have a high flood hazard. In this case study We also observe spatial insight into how sea-level rise contributes to flood risks in coastal areas. With this understanding, we can direct resources and mitigation efforts in more detail and have good spatial orientation. The resulting information in a more in-depth analysis and with more detailed data can be used for various purposes such as constructing better levees or drainage systems in the most vulnerable areas.
Another example is the ability of H3 Spatial Indexing to combine data on population density, infrastructure, and critical facilities in disaster risk analysis. By mapping these factors into H3 hexagonal cells, we can build modeling of how human vulnerability and infrastructure vulnerability can influence risk levels in different neighborhoods. This information is crucial in guiding policies and mitigation actions to protect communities and vital assets from disasters.
As technology continues to evolve, the opportunities for applying H3 Spatial Indexing in disaster management are expanding. We can envision the potential use of H3 in addressing various types of disasters, ranging from floods to earthquakes, forest fires, and more. By harnessing the strengths of H3 in mapping and analyzing geospatial data, we can develop more accurate predictive models, optimize resource allocation in emergency situations, and enhance the effectiveness of mitigation measures.
In the effort to develop the implementation of H3 Spatial Indexing, collaboration among various stakeholders, including governments, research institutions, and non-governmental organizations, is crucial. By sharing knowledge, experience, and resources, we can accelerate the adoption of H3 in disaster management and collectively achieve better outcomes. Innovations must be continuously explored and maximized. In doing so, we can build a more disaster-resilient society, safeguarding lives and assets, and reducing the negative impacts of natural disasters. Together, we can face the challenges of disasters more effectively and create a safer and more sustainable future for future generations.